In this digital era, data is often viewed as the foundation of indisputable truth. Statistical figures, convincing graphs, and precise percentages seem to provide objective certainty in a world full of uncertainty. However, there is an interesting paradox that we need to understand well. Even though the data we use is truly accurate and verifiable, the conclusions we draw from that data can be erroneous or misleading.
This problem does not lie in the quality of the data itself, but in how we present, combine, and interpret that information. Just like a photo that can be told from various different perspectives, data can also “tell stories” with diverse narratives depending on how we look at it.
This article will explore three main mechanisms that often cause distortion of meaning in data interpretation. First, we will discuss Simpson’s Paradox, a statistical phenomenon that shows how data aggregation can reverse the direction of relationships between variables. Second, we will examine the practice of cherry-picking, which is the tendency to select only parts of data that support a certain narrative. Finally, we will study the concept of framing, which is the way of packaging information that can direct readers’ perceptions even though the presented figures remain the same.
Simpson’s Paradox and the Trap of Data Aggregation
Simpson’s Paradox is a statistical phenomenon that shows that trends or relationships visible in separate data groups can reverse direction when that data is combined into one. Imagine looking at individual trees in a forest that appear healthy, but when we step back to see the forest as a whole, it turns out the ecosystem is experiencing damage.
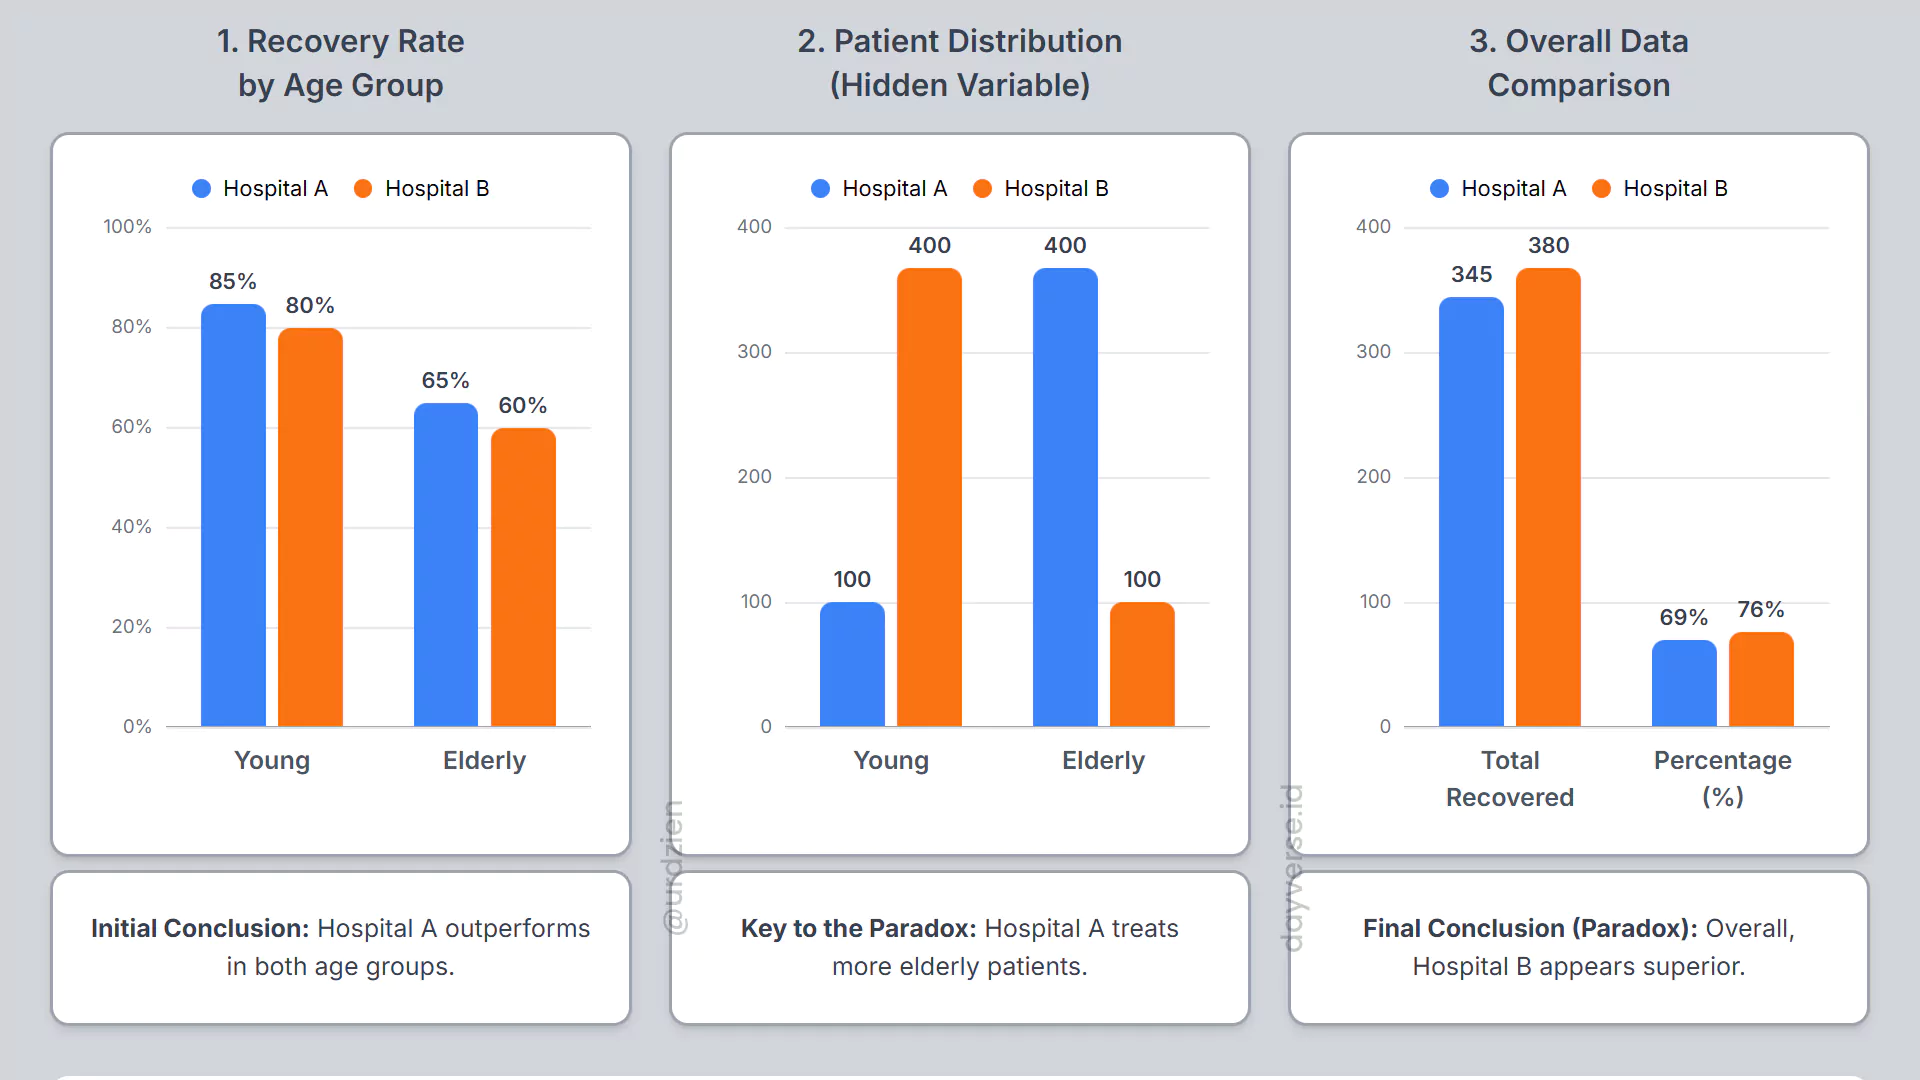
Let’s use an easily understood example about treatment success rates at two hospitals. Hospital A shows a recovery rate of 85% for young patients and 65% for elderly patients. Meanwhile, Hospital B has recovery rates of 80% for young patients and 60% for elderly patients. From this data, it’s clear that Hospital A is superior in both age categories.
However, when we combine all data without considering the age distribution of patients, the results can be surprising. If Hospital A mostly treats elderly patients who are more difficult to cure, while Hospital B mostly treats young patients, then Hospital B’s overall recovery rate could actually be higher than Hospital A’s.
This phenomenon occurs because the age variable acts as a confounding factor that is not accounted for in aggregate analysis. When we ignore the distribution of this confounding variable, we can arrive at conclusions that are opposite to the actual facts. Simpson’s Paradox teaches us that data aggregation is not merely simple addition, but requires deep understanding of the structure and characteristics of the underlying data.
It’s important to understand that this paradox is not an error in data or mathematical calculations. The data used is truly accurate, but the way we combine and conclude that information can be misleading. This reminds us that in data analysis, context and variable stratification are as important as the accuracy of the numbers we use.
Cherry-Picking and the Art of Selecting Numbers
Cherry-picking is the practice of selecting and presenting only parts of data that support a certain narrative or argument, while ignoring other information that might contradict or provide a more complete picture. Imagine someone who wants to prove that the weather in their city is always sunny, then only shows photos of bright days while hiding documentation of rainy days.
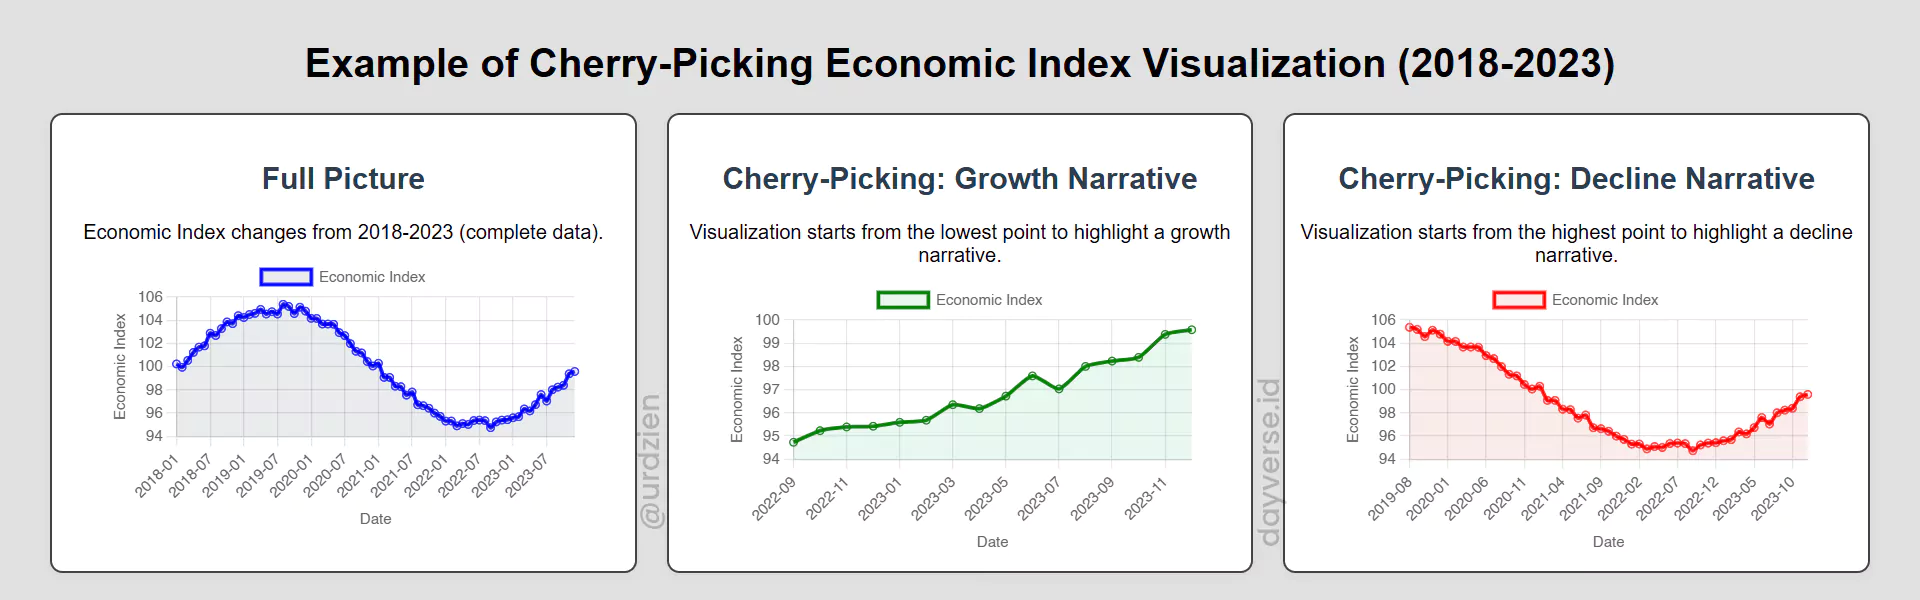
This practice is very common in various contexts, especially when data is used to support political positions, marketing strategies, or financial reports. An example we can easily find is the use of selective time ranges in presenting economic data. An analyst who wants to show that the economy is growing rapidly might choose a time period that starts right after an economic recession, so the graph shows a striking upward trend.
Conversely, if the goal is to show that economic conditions are deteriorating, that analyst could choose a time range that starts from the peak of economic growth to the decline period. Both presentations use correct and verifiable data, but give very different impressions about overall economic conditions.
Cherry-picking becomes dangerous because it provides an illusion of objectivity through the use of factual data, when in reality it only presents a small part of the complete picture. This practice does not involve data falsification, but ignores context and contradictory information so it can lead readers to biased conclusions.
In a world flooded with information like today, the ability to identify cherry-picking becomes a very valuable skill. We need to ask whether the presented data is representative, whether there is important information not displayed, and whether the chosen time range or sample has reasonable justification.
Framing and the Power of Presentation
Framing is the art of packaging information in a way that creates certain impressions or perceptions without changing the substance of the underlying data. This concept shows that how we present information can be as important as the information itself in shaping audience understanding and response.
A classic, easy-to-understand example is the difference between saying, “90% of patients successfully recover from this surgery” versus “10% of patients die from this surgery.” Both statements are mathematically identical and use the exact same data, but the psychological impression they create is vastly different. The first statement conveys optimism and emphasizes the success rate, while the second creates a sense of risk and danger.
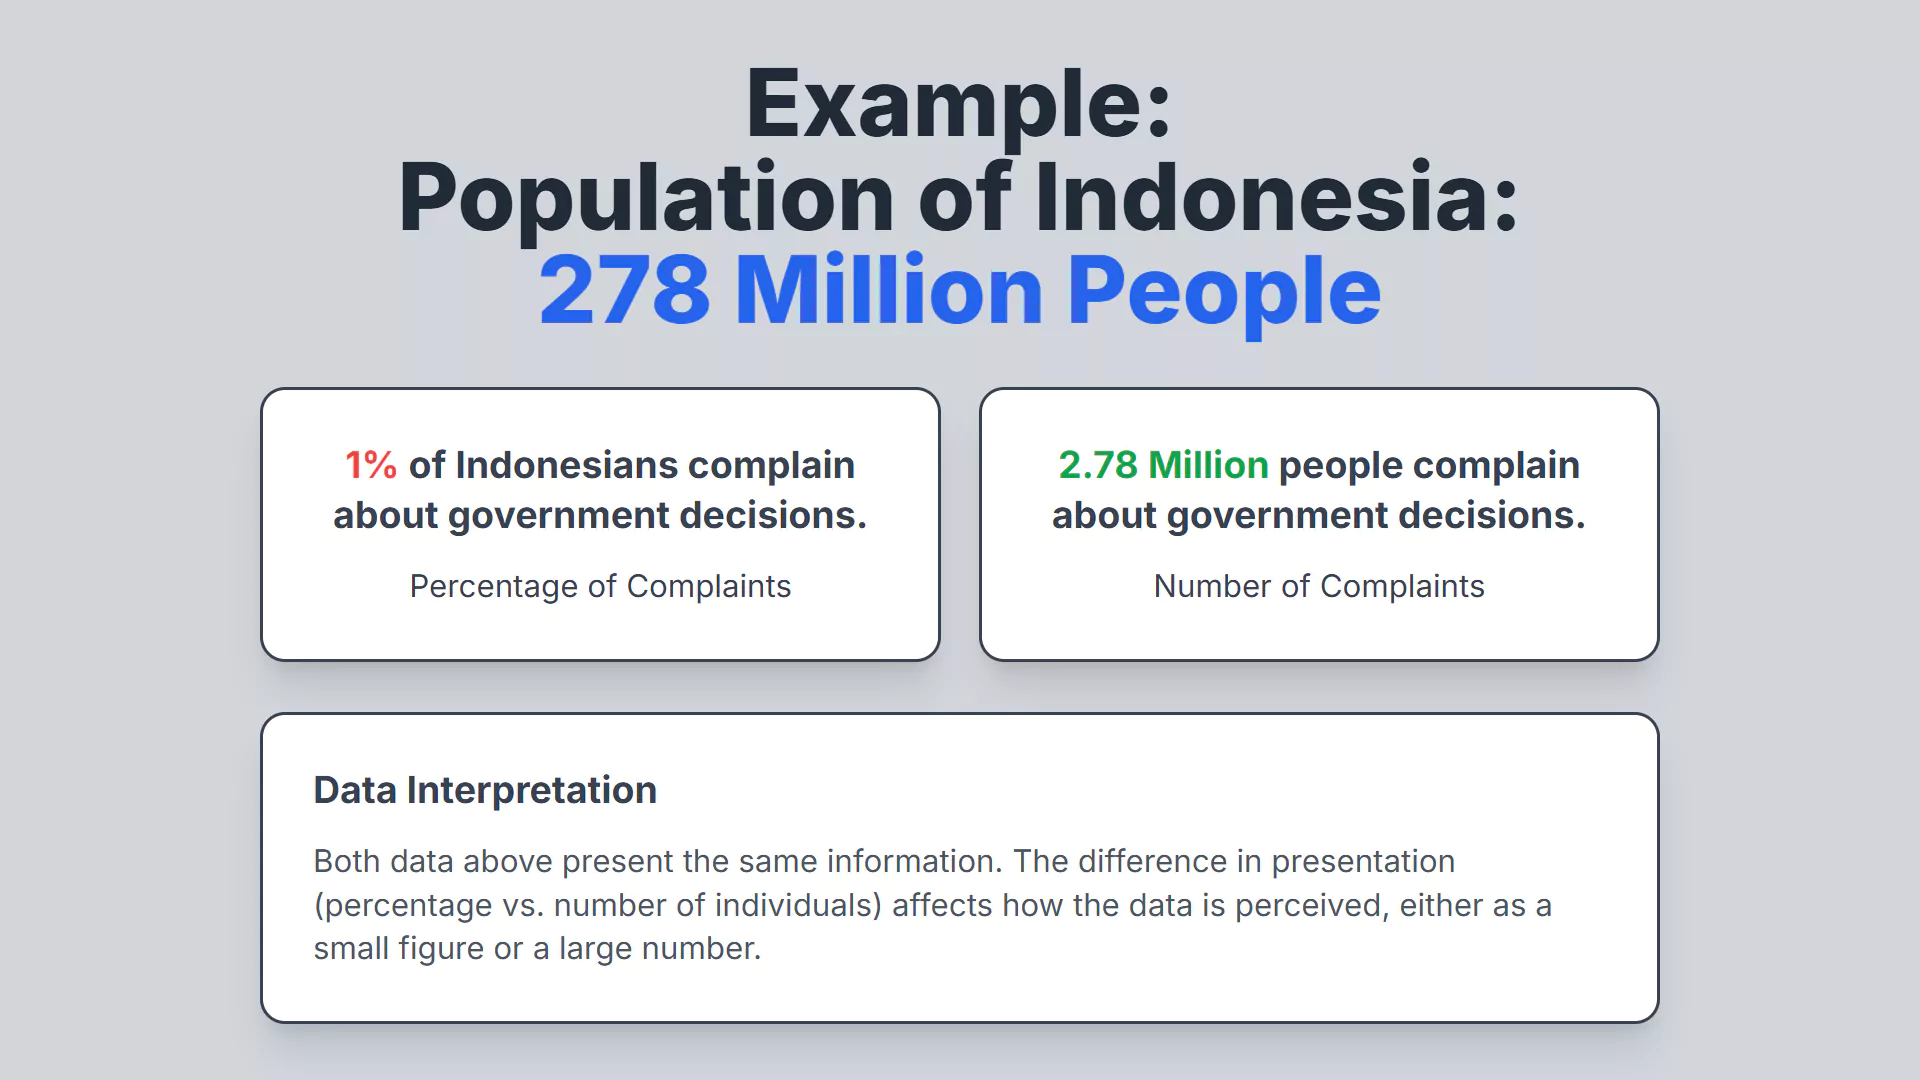
Framing can be found everywhere in daily communication. The mass media often uses this technique in reporting. For instance, assuming the population of Indonesia is 278 million, one media outlet might say that “Only 1% of Indonesians disagree” with a decision. On the other hand, another outlet could report that “There are about 2.78 million people who disagree” with the same decision. Both convey the same data, but the first minimizes the scale of disagreement, while the second highlights a significant number of people.
In a business context, framing is frequently used in marketing and financial reports. A company that has reduced its losses might use the framing “Improving Operational Efficiency” instead of “Still Experiencing Losses.” Both statements can be supported by the same data, but they create different narratives about the company’s performance.
What is interesting about framing is that it does not involve manipulating data or presenting false information. Instead, framing exploits the way human psychology works in processing information. Our brains tend to pay more attention to how information is presented rather than just the raw numbers it contains.
Understanding framing helps us become smarter consumers of information. When we encounter data presented in a certain way, we can ask how the same information could be presented differently, and whether an alternative perspective provides a different insight into the situation being discussed.
Reading Data with Critical Eyes
The three phenomena we have discussed show an important lesson that the truth of data does not automatically guarantee the truth of the meaning we derive from it. Simpson’s Paradox teaches that how we combine data can dramatically change conclusions. Cherry-picking reminds us that selectivity in information presentation can create significant bias. Meanwhile, framing demonstrates how packaging information can direct our perceptions without changing the underlying facts.
This understanding is not intended to make us overly skeptical of all data or information we receive. Instead, the goal is to equip us with the ability to read and interpret information more wisely. Data remains a very valuable tool for understanding the world around us, but we need to use it with deep understanding of the limitations and potential biases that may exist.
In this information age, the ability to think critically about data becomes an increasingly important skill. When we are faced with claims supported by data, we need to ask about context, completeness, and how that information is presented. Are there confounding variables not accounted for? Has all relevant data been presented? Does the way information is presented affect our interpretation?
By developing this critical attitude, we can become smarter information consumers and better decision makers. We don’t need to become statistical experts to be able to recognize potential distortions in data interpretation. What is needed is awareness that numbers, although they appear objective, are always packaged in the context of human interpretation that can influence the meaning we derive from them.